Web, Mobile and Desktop Applications
Are you a Fintech startup looking to get from prototype to production
Specialists in modern Javascript Charting and Grid UI
Experienced in Dashboards showing Data Visualization and Timeseries Analytics

Amazing Dashboards
Take your business to the next level with real-time business information from multiple data sources you can make better decisions with.
Data is everywhere inside your company, but the real power comes from combining different data sources. Imagine combining customer and operations data together with data APIs provided by 3rd parties and your suppliers.
The raw data should be grouped, aggregated and even pivoted into usable information. We use several grids from 3rd party vendors like this live updating example from Aggrid, that bring excel-like functionality and more into web components.
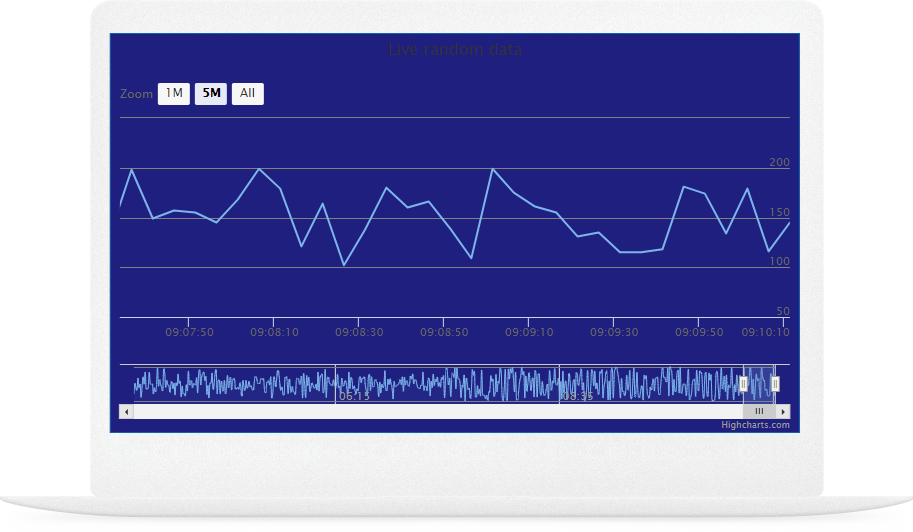
Visualization allows at a glance, to manage and diagnose business issues early. Sales, operations, finance, marketing, logistics are domains that charting and mapping technoloy can help you serve your customers better.
Another area to calibrate and automate are API tools to your suppliers and customers. Prepare quotes, receive orders, check stock or delivery times, set your business ahead of the competition
Let's start your project NOW
Digital Transformation is a strategic advantage
Maybe you have a project already defined, like a website or mobile app.
Or maybe you want to look critically at each touchpoint you have with your customers and value chain to generate some ideas to improve your business
Call or email us now
+ 44 787 9309376
[email protected]

